
Hi,
In this section, we will be dealing with K-Means clustering, a machine learning algorithm, which is used for grouping a large set of data to desired number of groups depending on their similarity. It will be a series of articles, may be two or three articles.
In this article, we mainly focus on the understanding what is this algorithm, how it works, what are its applications etc. I think an intuitive understanding is more better than explaining the mathematical background behind the algorithm.
In the coming articles, I will explain how to use in-built functions of Scipy and OpenCV for K-Means clustering.
(Note : All images are sufficiently larger, but resized to fit in page. Just click on the image to see it in its original size)
By the way, What is this algorithm for ?
According to Wikipedia :
k-means clustering is a method of cluster analysis which aims to partition n observations into k clusters in which each observation belongs to the cluster with the nearest mean.
( Reading above passage, I hope you might have understood at-least this : It groups large data to some groups based on some features.)
If you didn't understand above statements, I will tell a couple of examples :
1 - Google News :
I am sure you will have visited Google News at-least once. For every news, Google provides a main article and just below it, there are links to corresponding news from all other newspapers. Check below image :

This is one of my favorite features in Google News, because I try to read news on same topic from different papers. (It helps me to understand how media play with our minds. Different newspapers try to present same news in different ways to audience. And it is seen frequently with respect to political news and people reading them are, most often, got biased by these news, while real truth is hidden from them. Presently the power of media is such that, if you control the media, you control the world. Anyway, it is out of our topic. )
I have always wondered how does Google achieve this. I am not claiming Google uses k-means clustering, but this is what K-Means clustering also does, You have a large set of news and group them according to its content.
2 - T-shirt size problem
This example is commonly used to explain clustering problems.
Consider a company, which is going to release a new model of T-shirt to market. Obviously they will have to manufacture models in different sizes to satisfy people of all sizes. So the company make a data of people's height and weight, and plot them on to a graph, as below:
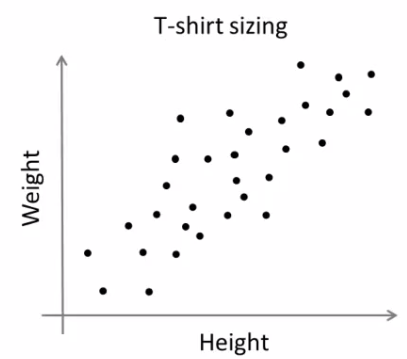 |
| People Height v/s Weight plot |
Company can't create t-shirts with all the sizes. Instead, they divide people to Small, Medium and Large, and manufacture only these 3 models which will fit into all the people. This grouping of people into three groups can be done by k-means clustering, and algorithm provides us best 3 sizes, which will satisfy all the people. And if it doesn't, company can divide people to more groups, may be five, and so on. Check image below :
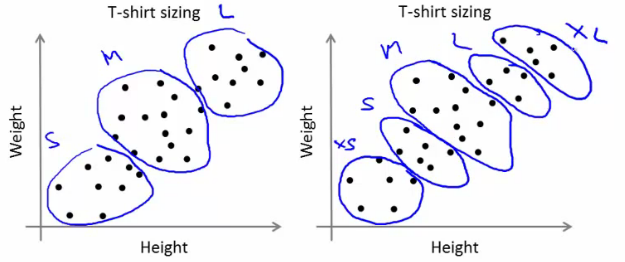 | |
| People grouped to different clusters |
So, now I hope, you might have understood use of this algorithm. Now we can go to next step.
How does the algorithm work ?
This algorithm is an iterative process. We will explain it step-by-step with the help of images.
Consider a set of data as below ( Don't be bothered about what this data is, or you can consider it as t-shirt problem). We need to cluster this data into two groups.
 |
| Test Data |
Step :1 - Algorithm randomly chooses two centroids, c1 and c2 (sometimes, any two data are taken as the centroids).
Step :2 - Then it calculates the distance from each point to both centroids. If a test data is more closer to c1, then that data is labelled with '0'. If it is closer to c2, then labelled as '1' (If more centroids are there, labelled as '2','3' etc).
In our case, we will color all '0' labelled with red, and '1' labelled with blue. So we get following image after above operations.
 |
| Initial centroid selection and data labelling |
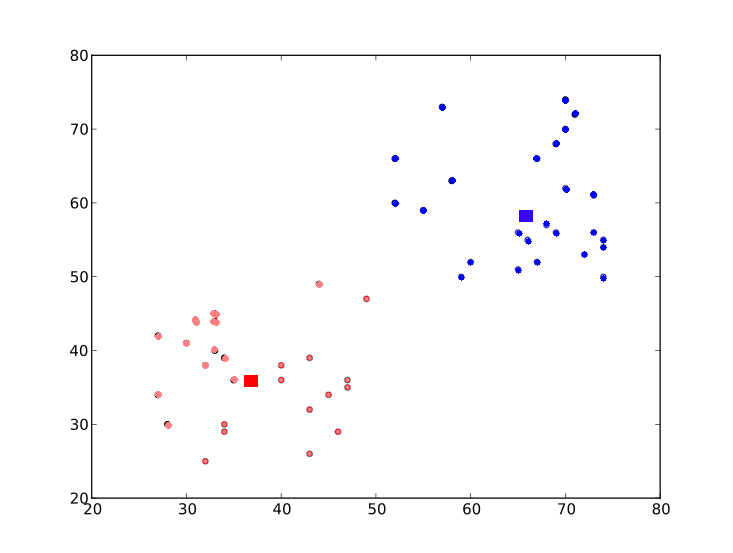
Step :3 - Next we calculate the average of all blue points and red points separately and that will be our new centroids. That is c1 and c2 shift to newly calculated centroids. (Remember, the images shown are not true values and not to true scale, it is just for demonstration only. So calculated averages may not be what you expect).
And again, perform step 2 with new centroids and label data to '0' and '1'.
So we get result as below :
 |
| New centroid calculated and data re-labelled |
Now step - 2 and step - 3 are iterated until both centroids are converged to fixed points. These points are such that sum of distances between test data and their corresponding centroids are minimum. Or simply, sum of distances between red data & c1 and blue data & c2 is minimum.
Final result almost looks like below :
 |
| Final Result |
So, I hope by this time, you would have obtained a basic understanding how K-Means clustering works. With this intuitive knowledge, read some good text books to understand the mathematics behind this algorithm. I am sure you won't find any difficulty to understand it.
It is just a top layer of K-Means clustering. There are a lot of modifications to this algorithm like, how to choose the initial centroids, how to speed up the iteration process etc. Me too, haven't gone much deeper and I think this would be sufficient to start working with K-Means clustering. Those who need more knowledge can read any good text books.
So that was a complete theoretical, easy-to-read article.
In next article, we will see how to use Scipy's kmeans implementation for data clustering, and we will deal OpenCV implementation in later article.
So that's all for now.
If you find this article useful, don't forget to share this article on Google+, facebook etc. It is just a click away !!!
Regards,
Abid Rahman K.
Ref :
1 - Stanford Machine Learning classes by Prof. Andrew Ng
No comments:
Post a Comment